CPU Graph
There is CPU Meter installed by default. It shows the current CPU usage level. I never understood why such tools are written. If you look at CPU Meter a second after the CPU-expansive process terminated, you can’t find out how high the peak was.
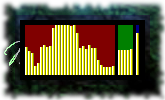
So I wrote this little gadget, which displays the CPU usage similar to IceWM’s tray app.
Screenshot
CPU Graph

Usage
Just look and enjoy.
The displayed areas :
- CPU ( red ) – updated twice each second
- RAM ( green ) – updated each 3 seconds
- Disk ( blue ) – updated each 3 minutes
Configuration
Configuration not really supported.
Versions
- 0.0 - February 2013
- Initial release.
- 0.1 - March 2013
- Update the areas with different frequency.
Plans
- A large size view, where CPU cores and disk partitions to be displayed separately.
- Configuration to set the area sizes and update frequencies.
Download
You can find the related files on GitHub in my Desktop-gadget repository’s cpu-graph directory :
- cpugraph.css - style
- cpugraph.html - document
- cpugraph.js - script
- gadget.xml - data